
Thank you for your enthusiastic and extensive engagement with our posts and research articles.
In today’s discussion, I aim to delve into the topic of Benefits of correlation in Stock Trading & explore the practical ways to implement in your trading strategy.
How you can reap benefits of Correlation in Trading ? Observe the Dance Party !!
In the dynamic world of stock trading, understanding the concept of correlation is like having a secret key that can unlock hidden patterns and relationships between different stocks. Imagine you’re at a dance party where every move of one dancer influences another – that’s what correlation in the stock market is like. Simply put, correlation measures how two stocks move in relation to each other. Correlation is a statistical mesure that ranges from -1 to +1. A correlation of +1 means two stocks move perfectly in sync, like best friends doing everything together. A correlation of -1 indicates they move in completely opposite directions, like rivals trying to avoid each other. And a correlation of 0? They are indifferent, moving independently.
Applications to Equity Trading So, why should a budding stock trader, like a college graduate, care about correlation? It’s all about strategy and edge .By understanding correlations, traders can diversify their portfolio, manage risk, and even spot trading opportunities. For instance, if you know two stocks typically move together and suddenly one diverges, it might signal a trading opportunity. Correlation helps in making informed decisions rather than relying on gut feelings.
Calculating Highly Correlated Stocks To start using correlation in trading, one must first learn how to calculate it. The Pearson Correlation Coefficient is a popular method. You can use spreadsheet software or trading platforms that offer this Statistics Package.You simply input the historical prices of two stocks, and voila, you get their correlation coefficient. A high positive number (close to +1) means they are highly correlated
How can you apply
Consider two major Indian companies, A and B. Say over the last year, their correlation coefficient is 0.85, indicating a strong positive correlation. If A’s stock price has been steadily rising due to strong earnings reports, and B’s price hasn’t caught up yet, a trader might invest in B expecting it to follow suit. Another example is when global events affect certain sectors similarly. During the pandemic, many IT companies’ stocks moved similarly, influenced by the increased demand for digital services.
Example of Correlation map displaying highly correlated stocks as generated using Python code reading the NSE 50 historical data or Adjusted Close Price of last 200 days.
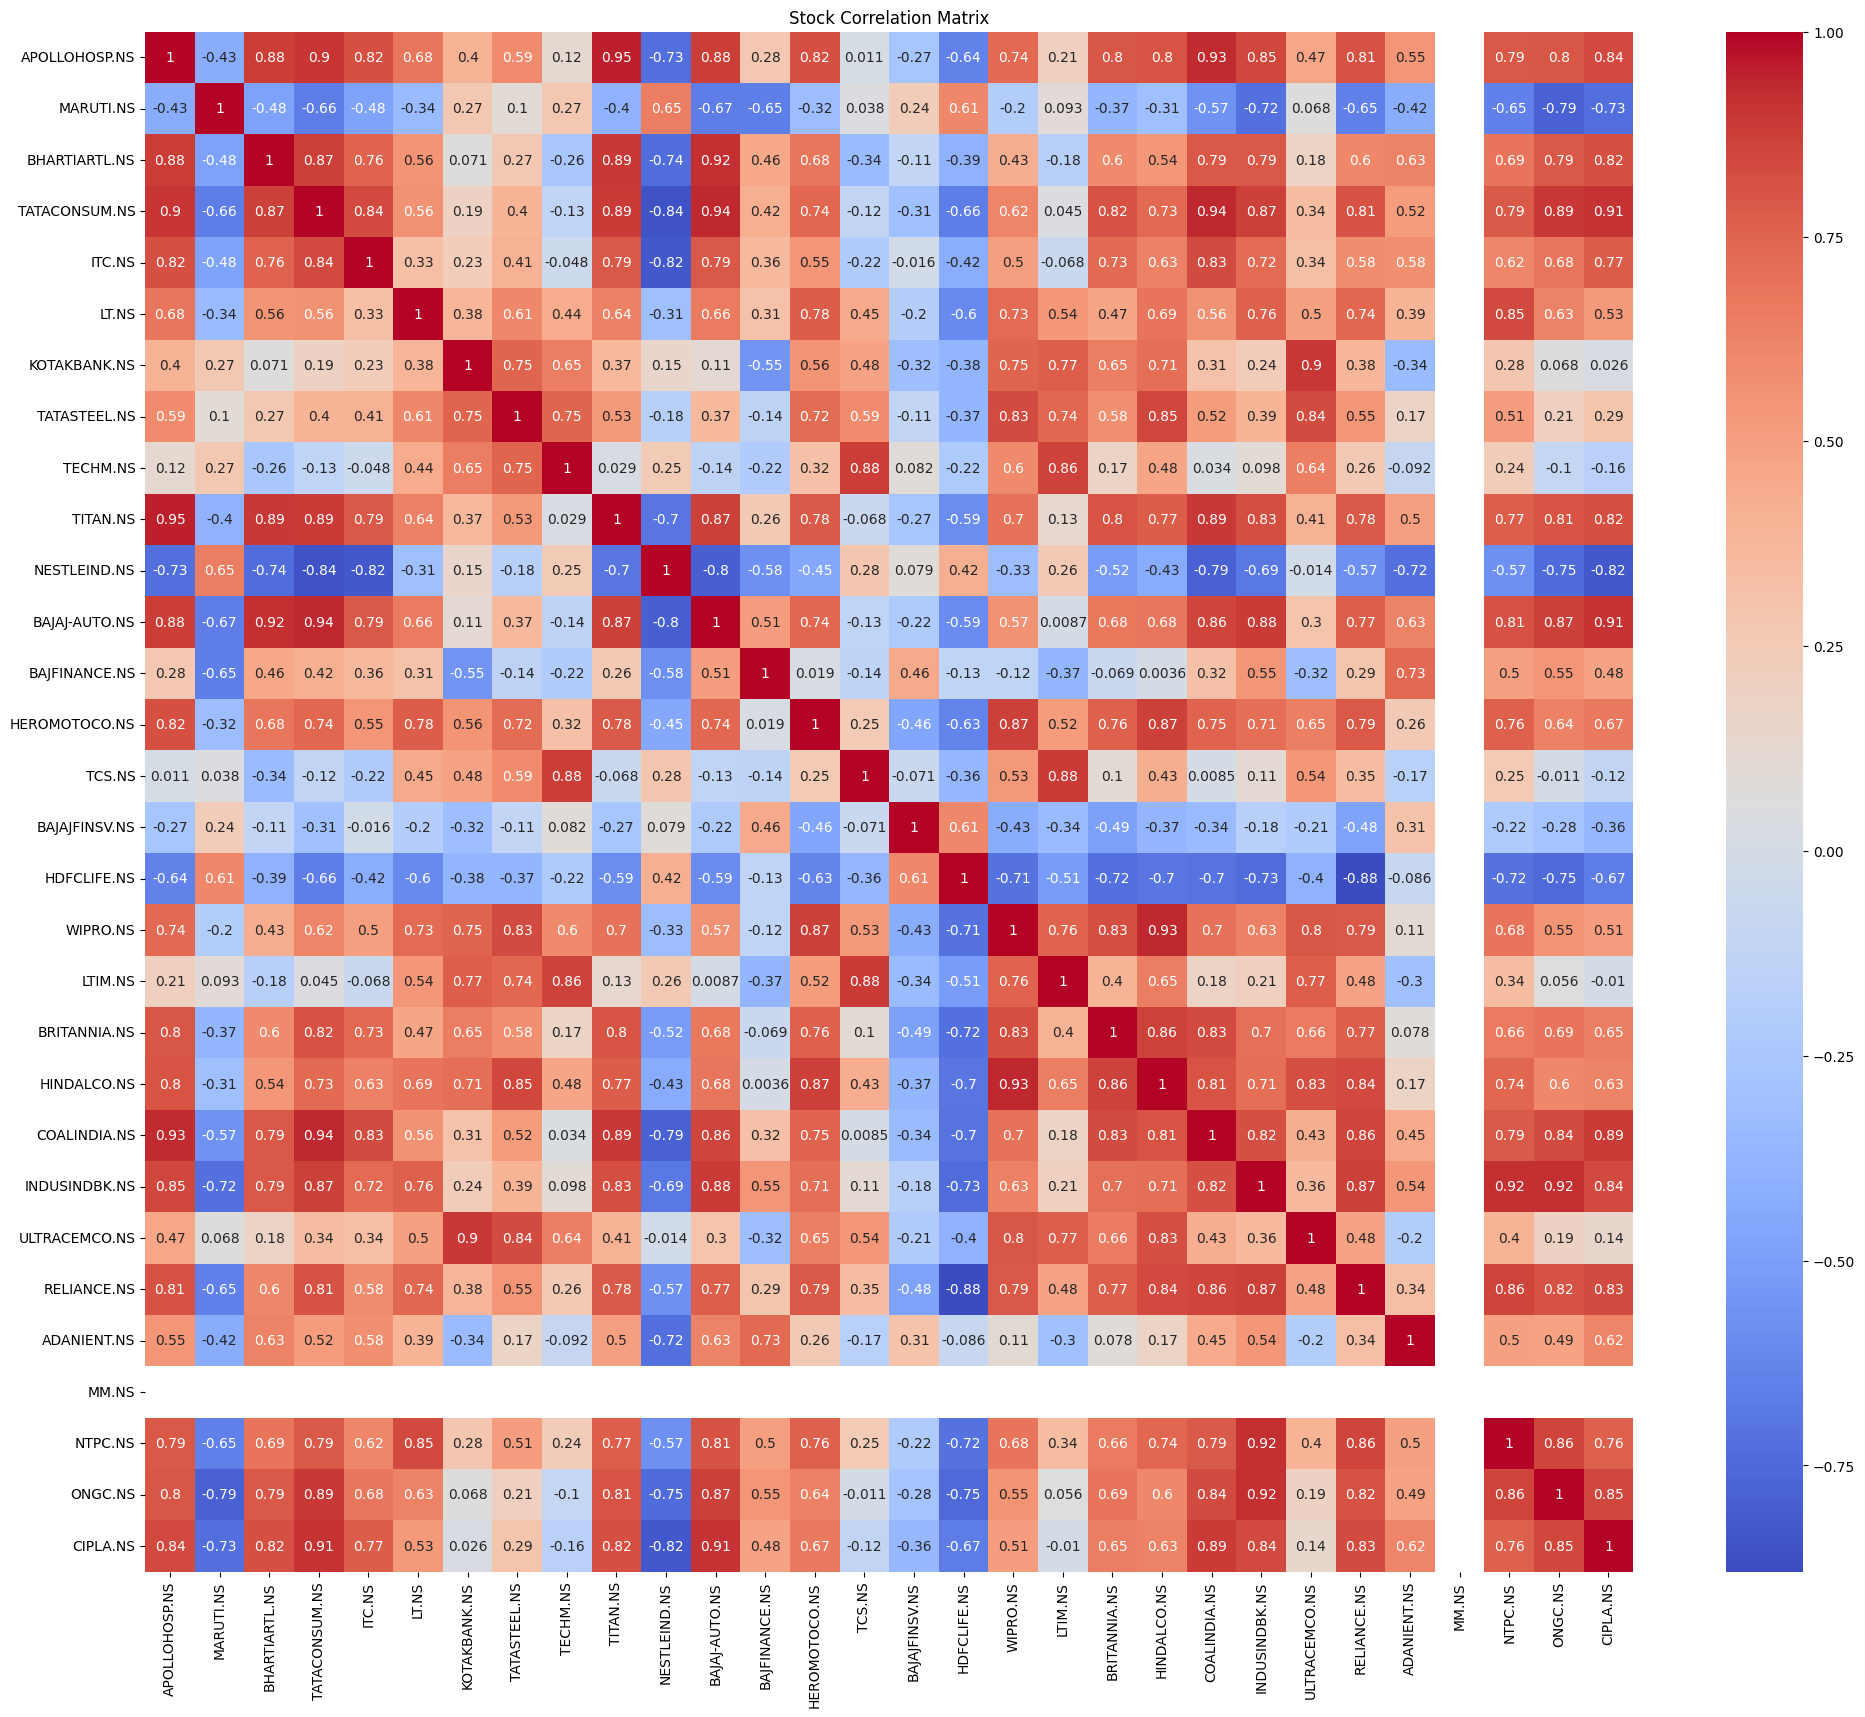
Confused ? Let me take you to the gist of correlation map have generated on Nifty 50 stocks considering last one year Close prices.
| Stock 1 | Stock 2 | Correlation Coefficient |
|---|---|---|
| APOLLOHOSP.NS | TATAMOTORS.NS | 0.952255 |
| BAJAJFINSV.NS | INDUSINDBK.NS | 0.943697 |
| APOLLOHOSP.NS | TATACONSUM.NS | 0.941417 |
| APOLLOHOSP.NS | TITAN.NS | 0.940724 |
| APOLLOHOSP.NS | ULTRACEMCO.NS | 0.919270 |
| Stock 1 | Stock 2 | Correlation Coefficient |
|---|---|---|
| TATACONSUM.NS | UPL.NS | -0.834139 |
| MARUTI.NS | UPL.NS | -0.853706 |
| ONGC.NS | UPL.NS | -0.857993 |
| TITAN.NS | UPL.NS | -0.863518 |
| TATAMOTORS.NS | UPL.NS | -0.881143 |
According to the first table, there’s a 95% correlation coefficient between Apollo Hospitals and Tata Motors, indicating a strong likelihood that investing in these two stocks would result in them moving upwards together. Contrastingly, the second table shows a negative correlation, as seen with Tata Consumer & UPL, which have a -85% correlation indicates that if one moves up and other is likely to move down ( vice versa)
The point i want to drive home is the correlation is a powerful tool in stock trading. It’s like having a map in a treasure hunt; For anyone stepping into the stock market, understanding and applying correlation can be a game-changer. It’s about being smart, strategic, and one step ahead in the game of stocks. Happy trading!
Feel free to contact me in case you need the Python Code to generate the correlation map / results as shown above.
Cheers
Srikanth
![]()